Categorizing rainfall anomalies
Using the values in the table above, it is possible to categorize the rainfall observed in the current year in relation to the values observed in the previous records since the beginning of the available series, so the observed values below the 5% quantile characterize the basin in an extremely dry condition, between 5 and 12.5% in an extremely dry tendency condition, between 12.5 and 20% very dry condition, between 20 and 27.5% very dry tendency, between 27. 5 and 35% dry condition, between 35 and 42.5 dry tendency condition, values between 42.5 and 57.5 define normal condition, values between 57.5 and 65% rainy tendency condition, between 65 and 72.5% rainy condition, between 72.5 and 80% very rainy tendency, between 80 and 87.5 very rainy condition, between 87.5 and 95% indicate extremely rainy tendency and finally values above 95% define the basin in extremely rainy condition, as per the legend below.
| QUANTIL | 5.0% | 12.5% | 20.0% | 27.5% | 35.0% | 42.5% | 57.5% | 65.0% | 72.5% | 80.0% | 87.5% | 95.0% | |
|---|---|---|---|---|---|---|---|---|---|---|---|---|---|
| INDICE | -3.0 | -2.5 | -2.0 | -1.5 | -1.0 | -0.5 | 0.0 | 0.5 | 1.0 | 1.5 | 2.0 | 2.5 | 3.0 |
| CATEGORIA | Extremely Dry | Extremely Dry Tendency | Very Dry | Very Dry Tendency | Dry | Dry Tendency | Normal | Rainy Tendency | Rainy | Very Rainy Tendency | Very Rainy | Extremely Rainy Tendency | Extremely Rainy |
The tables below show (Table 2A) the average precipitation observed (mm) in each basin, taking as reference the precipitation estimates by satellite using the MERGE technique, available at MERGE/GPM/DAILYaccumulated in 30 days on the indicated dates, the average values of the categorized anomalies (Table 2B) were estimated based on the anomaly value of each pixel in the monitored watershed area, calculated according to the methodology described in the previous item, on the same dates of precipitation monitoring, the color scale of the anomalies follows the legend described.
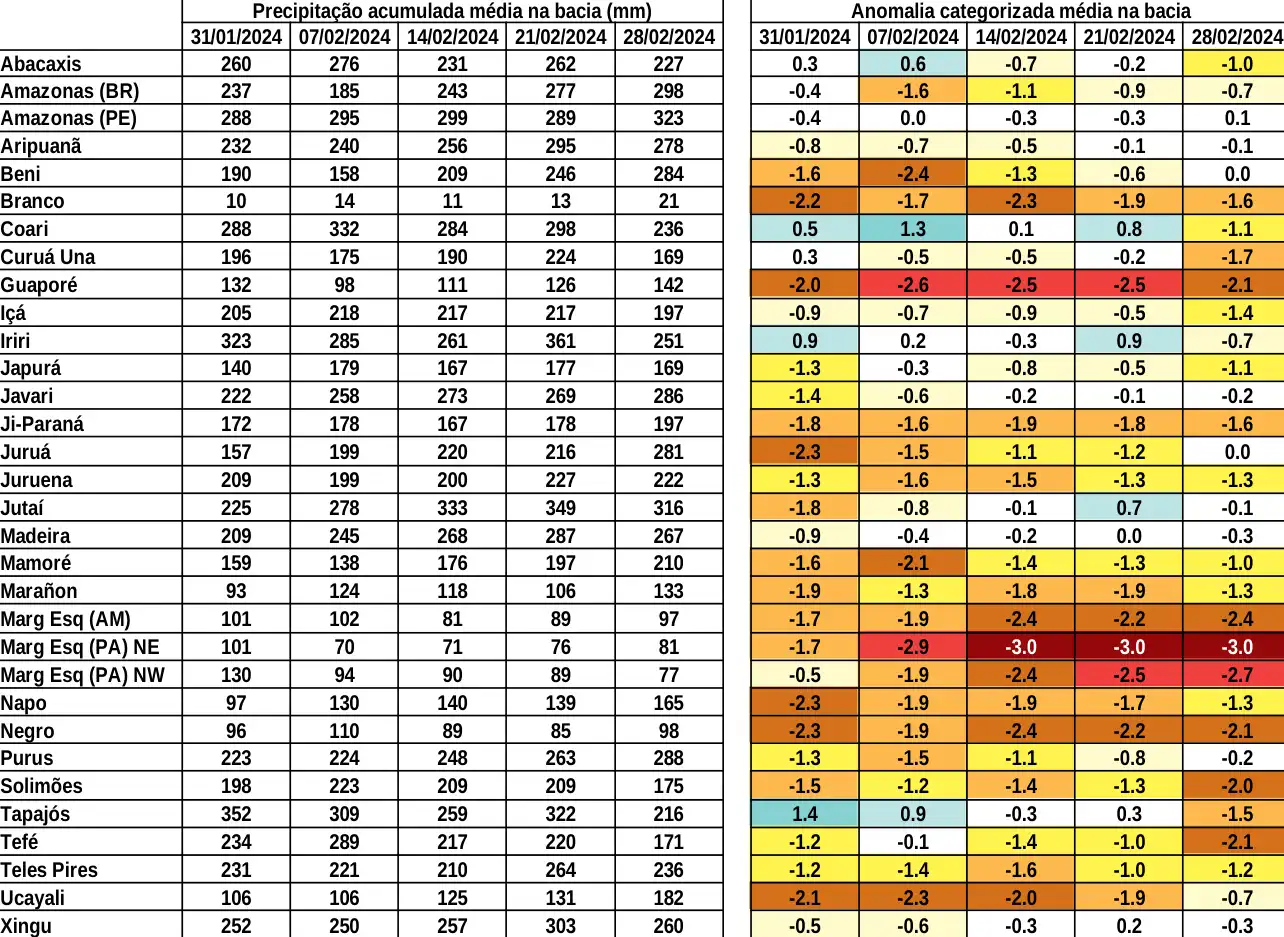
Table 2A. Accumulated rainfall over 30 days (mm)
data MERGE/GPM – INPE/CPTEC.
Table 2B. Categorized precipitation
anomaly by quantiles