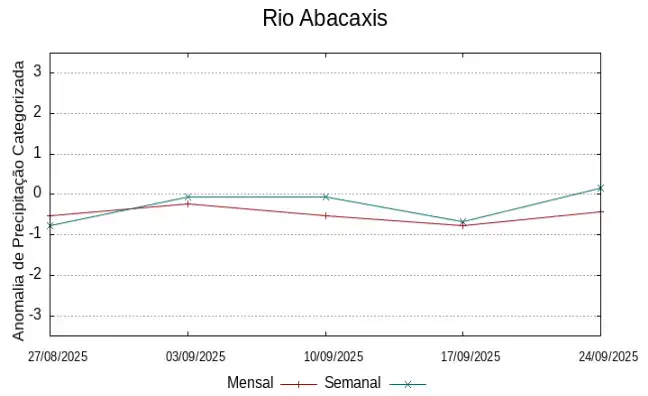
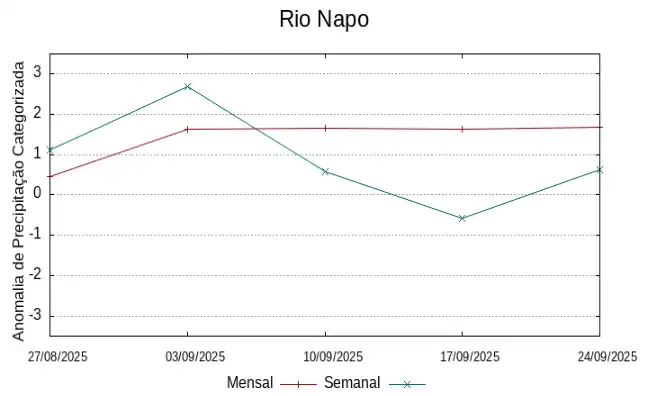
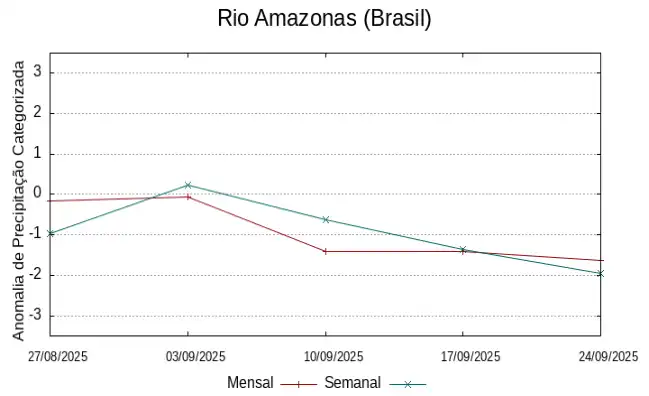
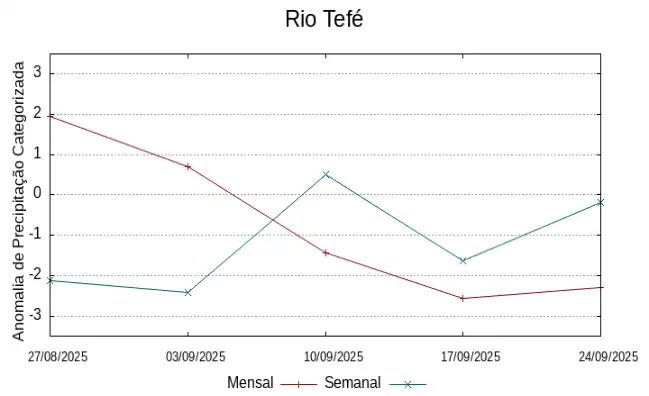
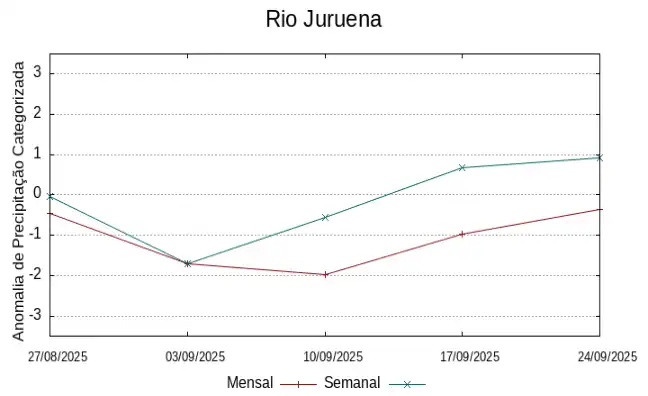
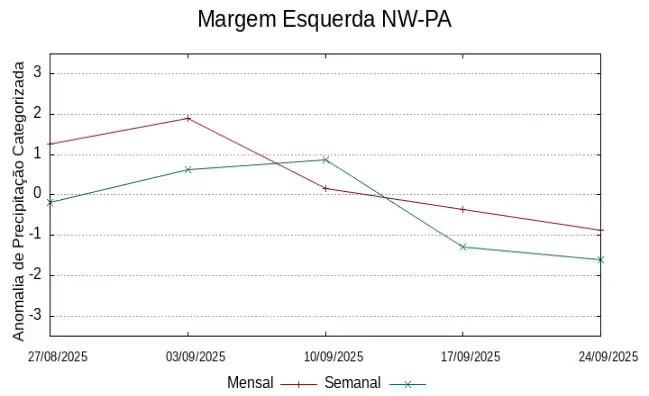
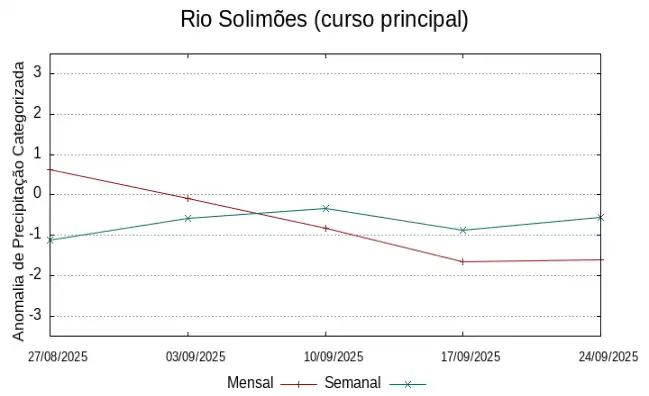
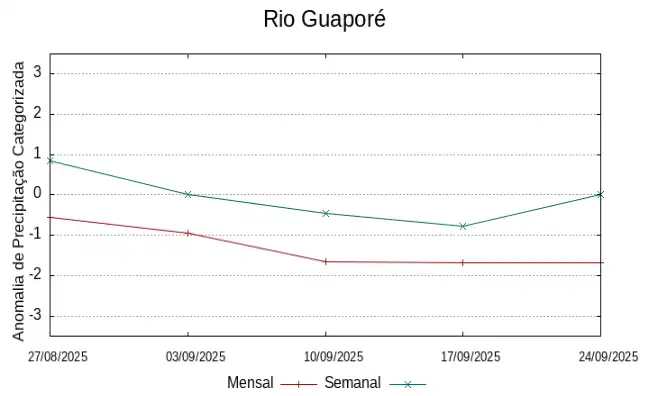
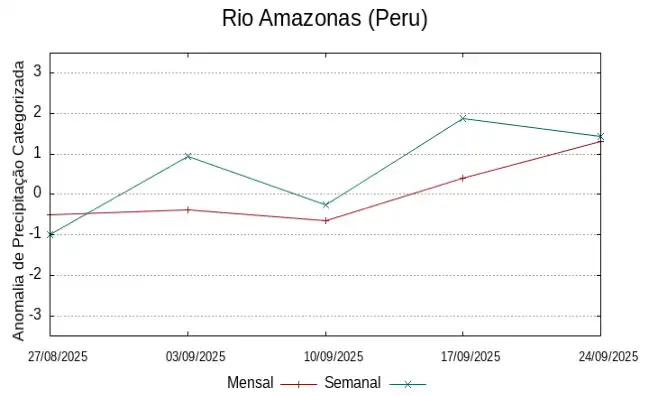
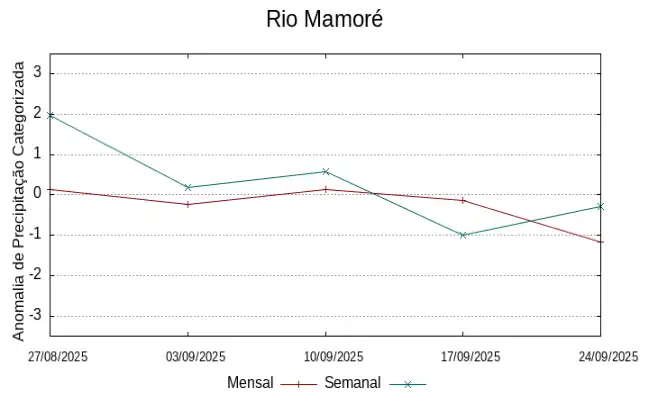
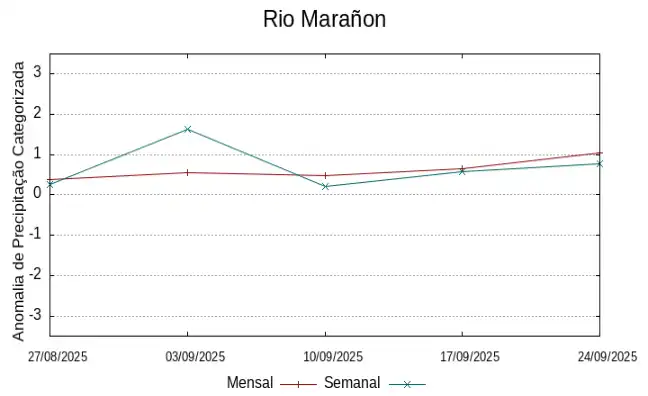
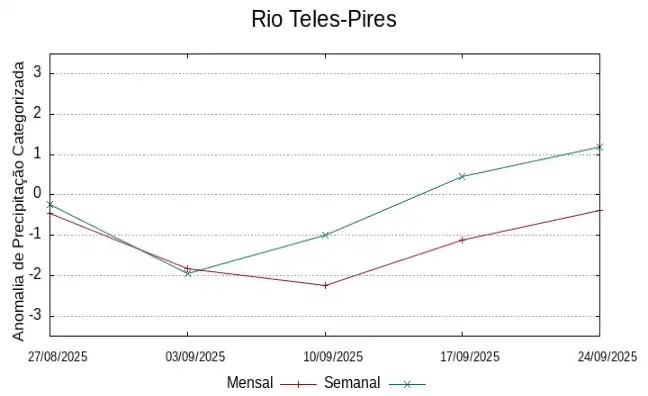
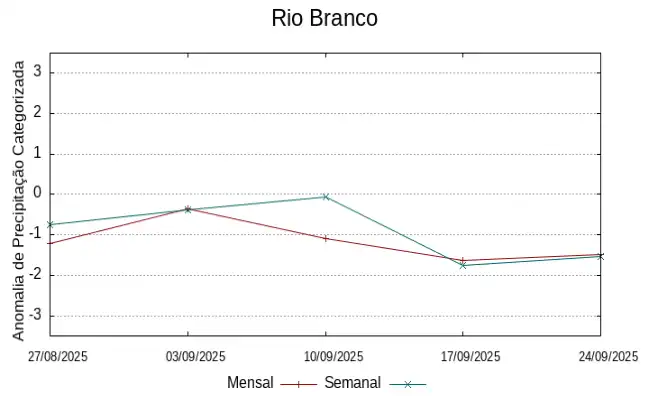
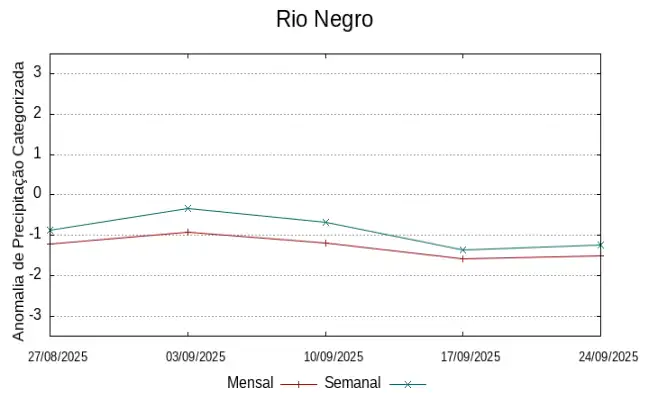
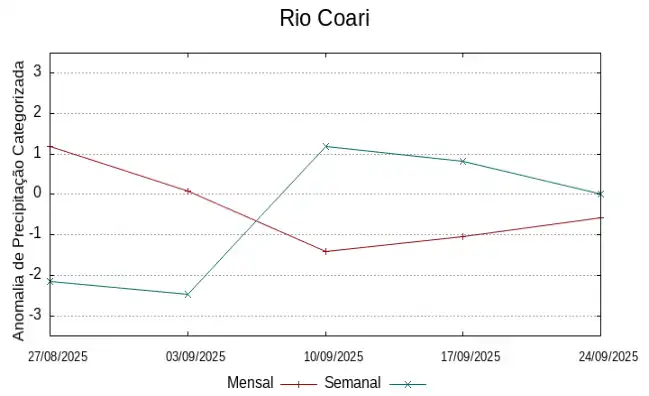
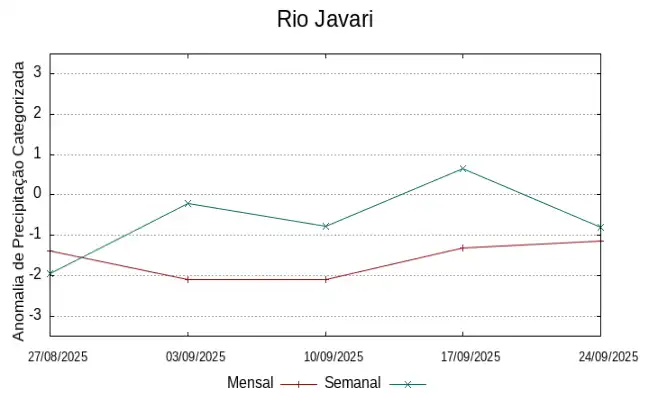
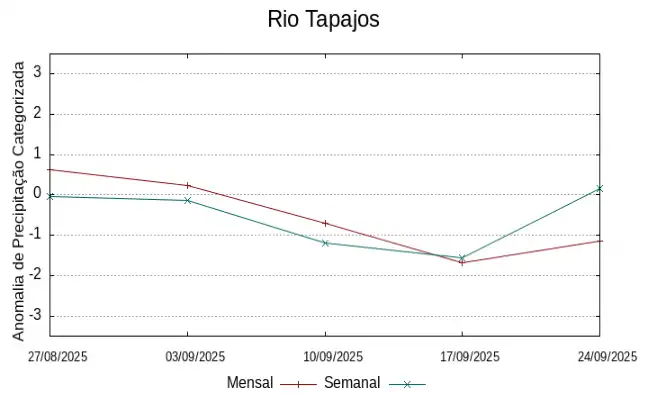
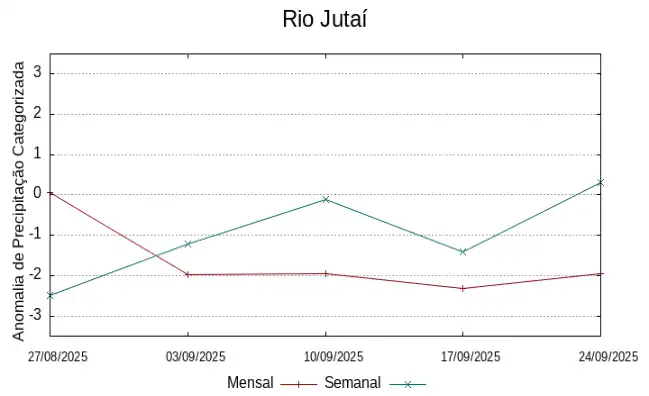
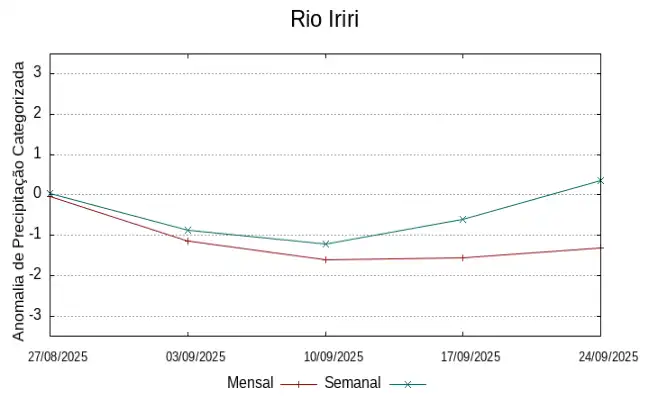
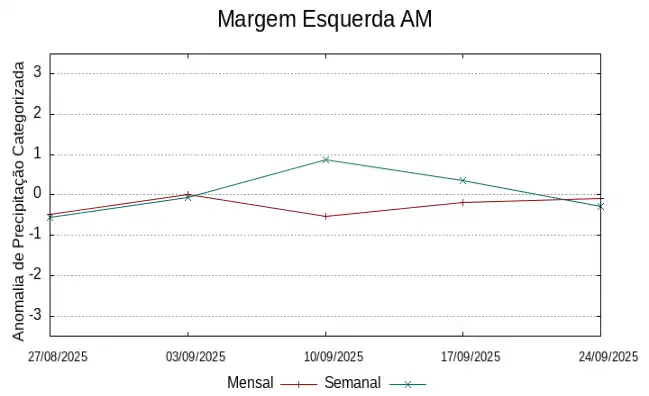
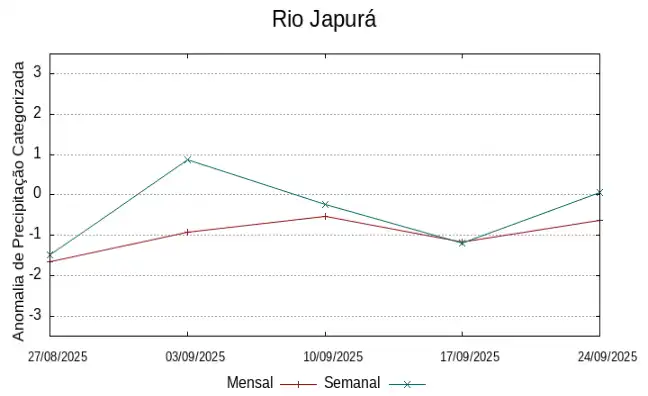
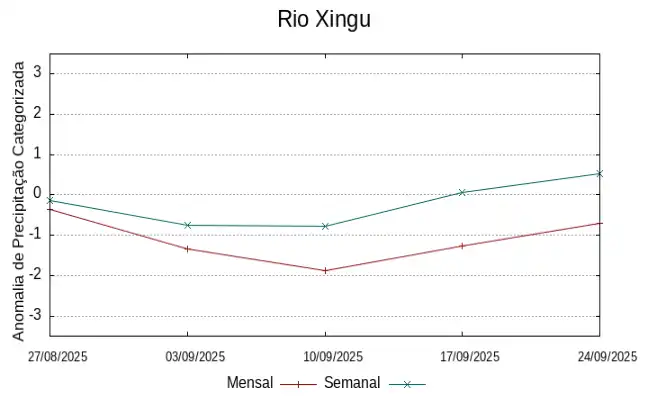
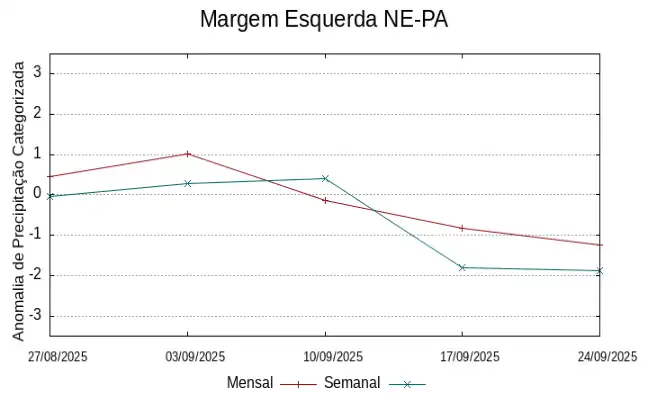
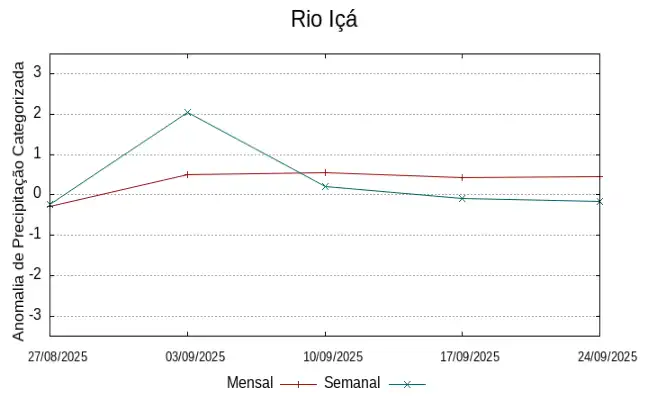
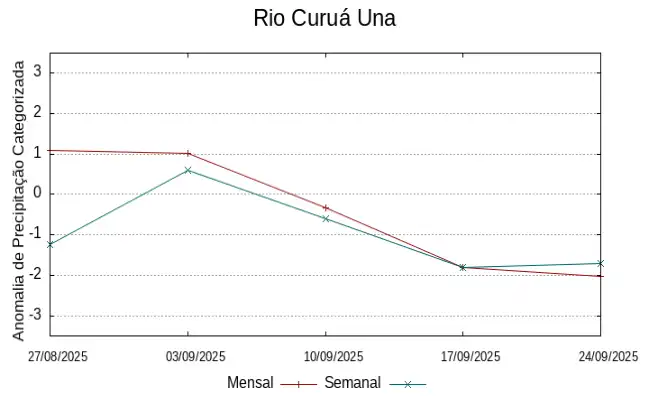
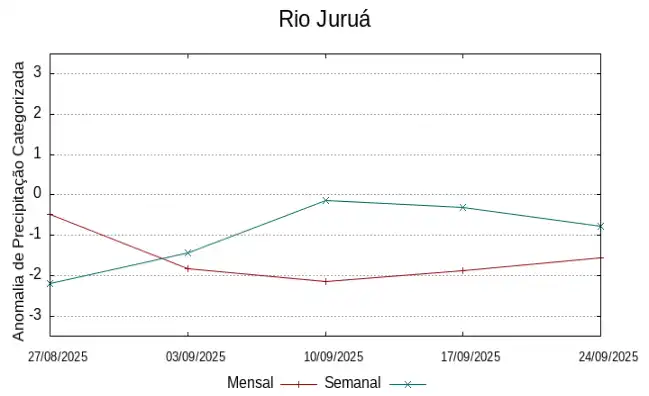
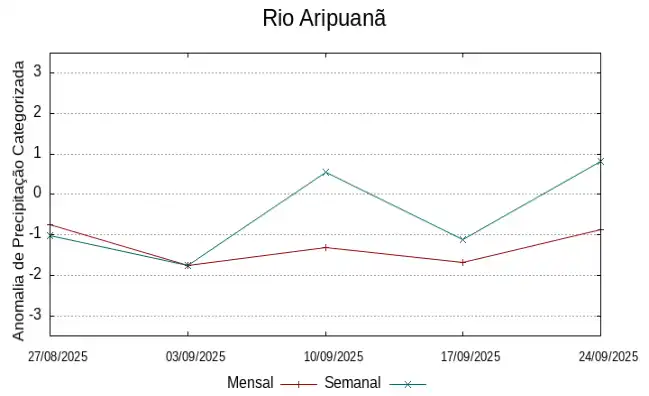
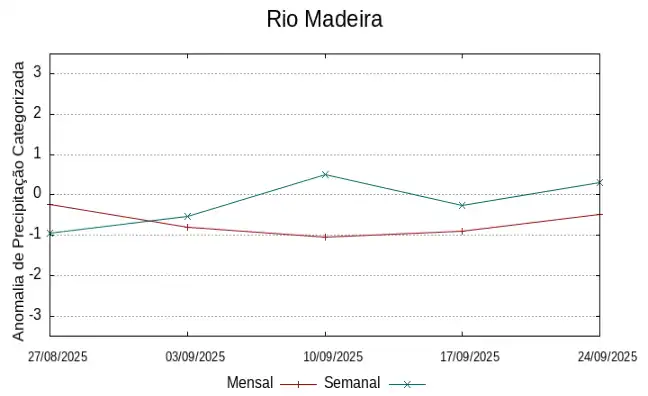
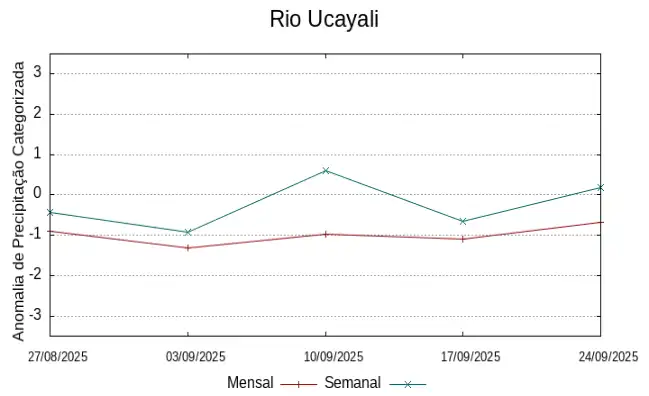
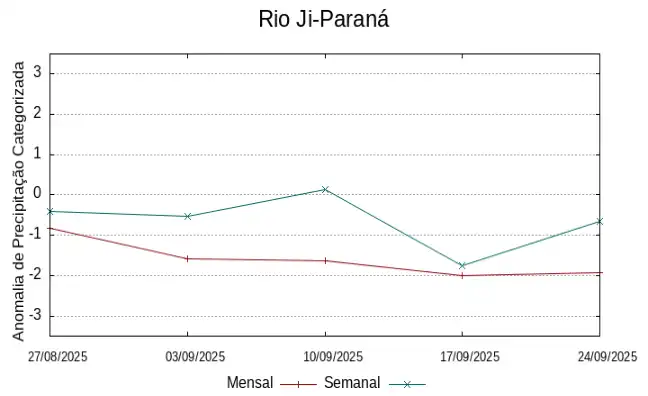
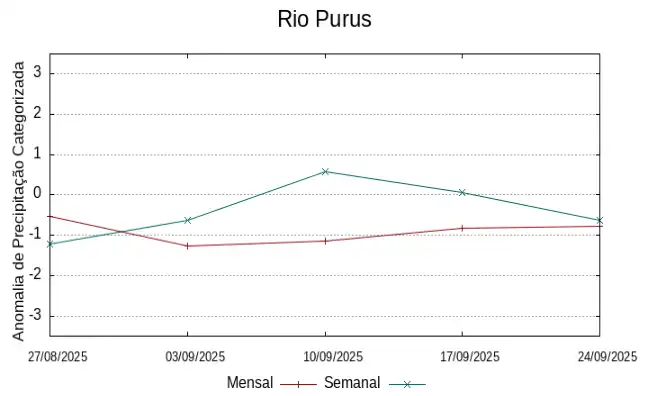
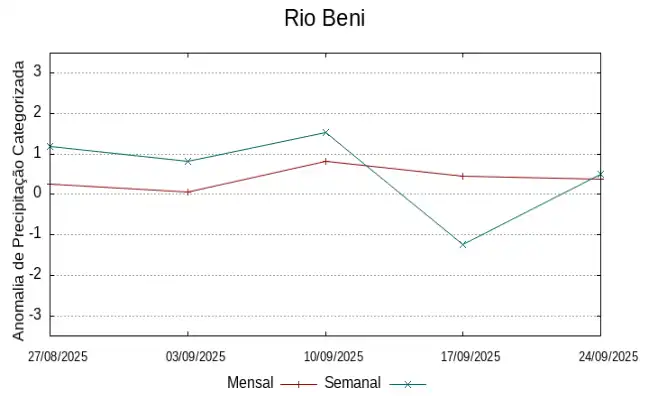
Behavior of the 07 and 30 days anomalies observed in previous weeks
The following graphs illustrate the behavior of the precipitation anomaly index in recent weeks, red lines show the behavior for periods of 30 days and blue lines the behavior for periods of 7 days, updated weekly.