Individual analysis by river basin
Branco River Basin
Updated on July 29, 2026
Accumulated precipitation vs climatology
30 days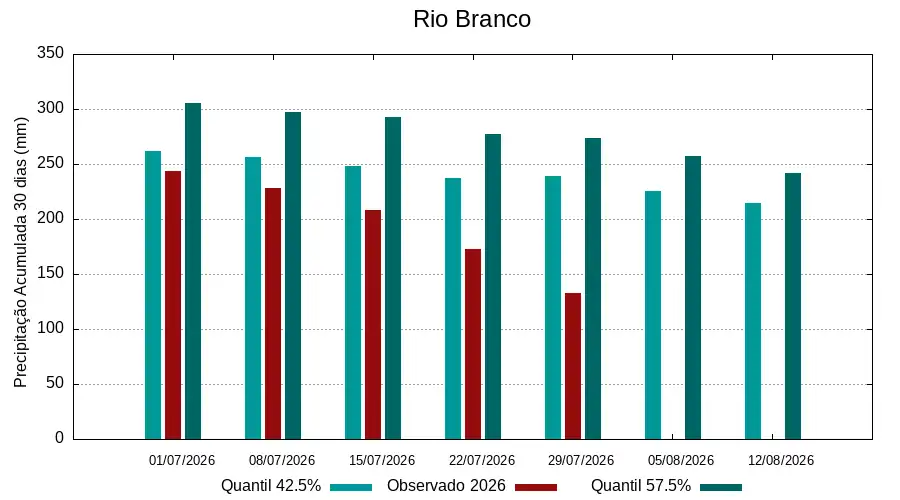
Comparison between climatological quantiles and observed accumulation.
Anomaly and trend
14 to 28 days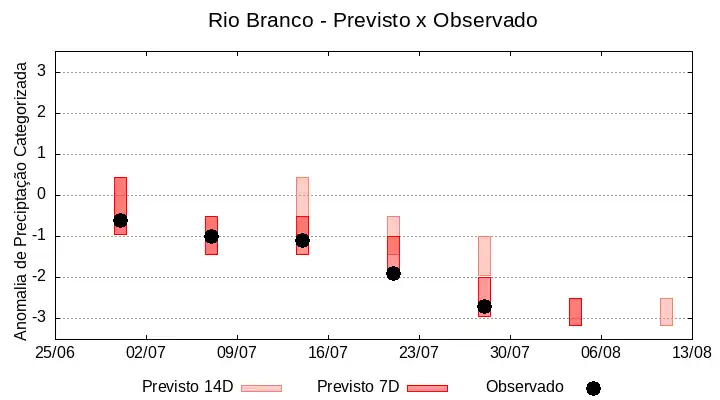
Anomaly, forecast and observed indicators.
Basin highlights
The climatology of the period under analysis indicates rainfall with records varying between 239 and 274 mm being considered normal (reference quantiles 42.5% and 57.5%). On July 29, 2026, 132 mm of average accumulated precipitation was observed over the basin in 30 days, the calculation of the average of the categorized anomaly index in the basin area the value of -2.7, classifies the basin as tendency to extremely dry condition. In the coming weeks, climate behavior indicates a decrease in rainfall volumes, the sub-seasonal forecast model suggests extremely dry behavior or a tending to be extremely dry.
Climatology
239 mm - 274 mm
Observed 30 days
132 mm
Anomaly index
-2.7
Basin classification
tendency to extremely dry condition
Forecast
extremely dry behavior or a tending to be extremely dry